WHAT DO WE COVER?
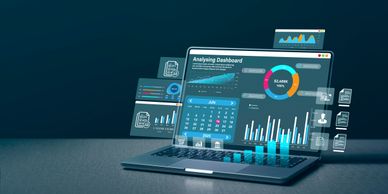
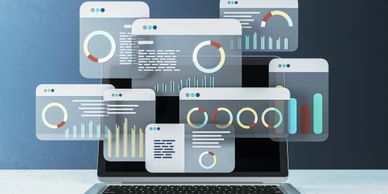
AI Driven Dashboards
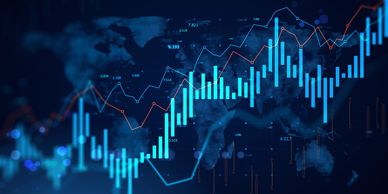
Predictive Analytics & Forecasting

Real time Power BI dashboards built for your sector - turning complex projects data into clear actionable insights.
Predictive Analytics & Forecasting
Predictive Analytics & Forecasting

AI models that detect risks early, forecast cost and schedule trends, and automatically generate data-driven performance oversight
Automated Executive Reporting

Automatic monthly and on demand reports summarising performance, forecasts and KPIs - generated and distributed without manual effort.
Seamless Data Integration

Connect effortlessly with Excel, ERP, CRM, BIM and Project Management Systems. Creating a unified data environment across your business.
Monthly Performance Summaries
Continuous Optimisation & Support
Generates automatic monthly summaries of cost, performance, and schedule status - delivered directly to management.
Continuous Optimisation & Support
Continuous Optimisation & Support
Systems are proactively monitored, updated and fine tuned to maintain accuracy, performance and reliability.
Automated Data Collection
Optional System Enhancements
Automated Data Collection
Pulls live data from spreadsheets, site reports or forms using our automation model - reducing manual entry and ensuring accuracy.
Unlimited User Access
Optional System Enhancements
Automated Data Collection

Your entire team, subcontractors and management can access live insights anytime*
Optional System Enhancements
Optional System Enhancements
Optional System Enhancements

Request dashboard updates, new integrations, or added functionality as your operations evolve*
Scalable AI Automation
Optional System Enhancements
Designed to grow with your business - from 10 projects to 100+, maintaining consistent reporting and intelligence at every level.
Role-Based Views

Creates tailored dashboards for Directors, Project Managers and Operational Teams. Each seeing relevant data automatically.
Historical Project Analysis

Keeps a performance history of completed projects for benchmarking future tenders and improving planning accuracy.
Automated Client Reporting
Continuous System Monitoring

Produces branded dashboards - ready to share with clients and stakeholders.
Continuous System Monitoring
Continuous System Monitoring
Automatically checks and refreshes data, integrations and dashboard performance - sends alerts if something has failed.
Supplier & Cost Tracking
Resource & Labour Overview
Tracks supplier spend, invoices, purchase orders and material costs live against budgets to spot overruns early.
Resource & Labour Overview
Resource & Labour Overview
Monitor labour hours, subcontractor costs and productivity trends without manual updates.
Milestone Tracking
See live progress on key milestones and upcoming deadlines across all active projects.
Variation & Change Tracking
View all approved variations and their impact on cost, duration and supplier performance.
Project Health Overview
Combine RAG, spend variance and schedule data into one quick "Project Health" snapshot.
Forecast & Actuals
Compare planned vs actual cost and completion dates - with automatic future projections.
Issue & Risk Summary
Issue & Risk Summary
Track open risks, overdue actions and mitigations in progress for clear accountability.
